
2026 reference ranges · TMR
You formulate the ration carefully, check dry matter, fine-tune the concentrates… but do you know what the cow actually eats at the bunk? The Penn State Box is the fastest way to check it right on the farm. In this first post of the series, we show why dairy producers and nutritionists rely on it so much.
The reference ranges for TMR
Updated ranges for high-producing cow TMR (% as-fed weight, 3 sieves + pan).
19 mm
2–5%
Long particles; above this, more sorting
8 mm
>50%
Intermediate structural fraction
4 mm
10–20%
Medium fraction
Pan
25–30%
Fine particles
A variation of more than 5 points on any sieve between the TMR and the refusals means sorting at the bunk.
Source: Grant (2026), Dr. Mike Hutjens class.
Calculate my sample
FULL CLASS ON RUMINANTS.AI
Mentorship: Optimizing Dry Matter Intake with Dr. Mike Hutjens

Dr. Mike Hutjens
Professor Emeritus · University of Illinois
- The full Grant (2026) table: Penn State Box ranges for TMR, corn silage and grass/legume silage.
- Where to sample along the bunk: start, middle and end of delivery, and comparing the TMR with refusals.
- Diet moisture: optimal DM of 45% to 55% and what to do when the TMR is too wet or too dry.
- Bunk management: refusals of 2% to 3%, push up the TMR 4 to 6 times a day and never leave the bunk empty more than 30 minutes.
- Feed efficiency: kg of ECM per kg of DM targets for each pen.
The reference range for the pan is 25–30%. Above that, look into prolonged mixing, finely ground grain or a high proportion of concentrate and by-products, but always together with forage NDF, starch and its fermentability, rumination and intake. The Penn State Box alone does not diagnose acidosis. An excess on the 19 mm sieve (above 5%) raises the risk of sorting at the bunk and may limit intake.
Content source: this article is based on the answer the Ruminants.ai app gave to the question “Why should I use the Penn State Box?” and on the Penn State Particle Separator User Manual (Santafé Agroinstituto + Ruminants.AI, 2026), supported by the references listed at the end.
The ration on paper is not the ration in the bunk
A diet can be perfect on paper and wrong at the bunk. Particle size, together with the amount and source of NDF, determines the physical ability of the diet to stimulate rumination and sustain the rumen environment. Long, fibrous particles help form the rumen mat, the fibrous layer floating in the rumen, and generally require more chewing.
The Penn State Box is a set of four trays that nest on top of each other, always with the largest holes on top:
| Box | What it retains |
|---|---|
| 19 mm | Particles larger than 19 mm: long particles, mostly forage |
| 8 mm | Between 8 and 19 mm: intermediate structural fraction |
| 4 mm | Between 4 and 8 mm: medium fraction |
| Pan | Smaller than 4 mm: fines |
You add about 1.4 liters of TMR or silage, as fed, shake it in a standardized way, and weigh what stays on each level. In about 10 minutes you have the feed’s particle size distribution. The work by Kononoff et al. (2003) is one of the classic references on the Penn State Box, including how moisture affects the measurements.
Three uses that pay for the Penn State Box
1. Effective fiber. The Penn State Box assesses whether the diet has a particle distribution with the potential to deliver physically effective fiber. It measures physical distribution; it does not replace a composition analysis. Learn the difference in physically effective fiber.
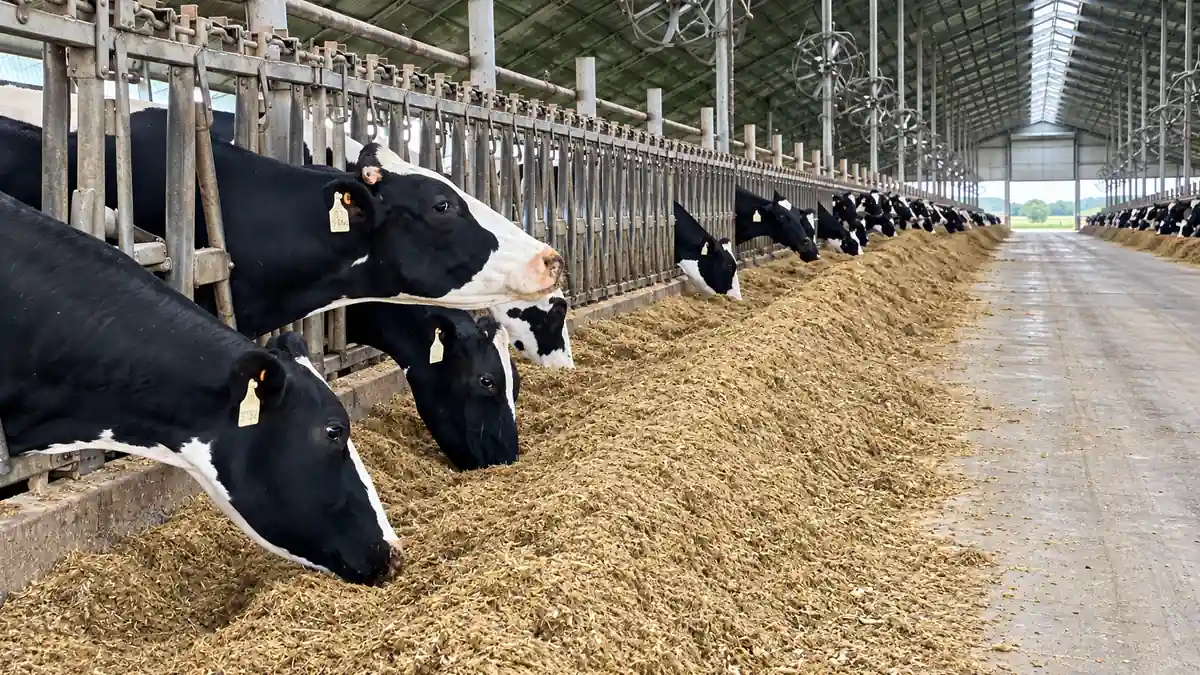
2. Sorting at the bunk. By comparing the TMR offered with the refusals from the same pen, you find out whether cows are sorting, especially rejecting the long particles. The rule of thumb: a difference of more than 5 percentage points on any tray between the TMR offered and the refusals indicates sorting at the bunk. See how in TMR sorting.
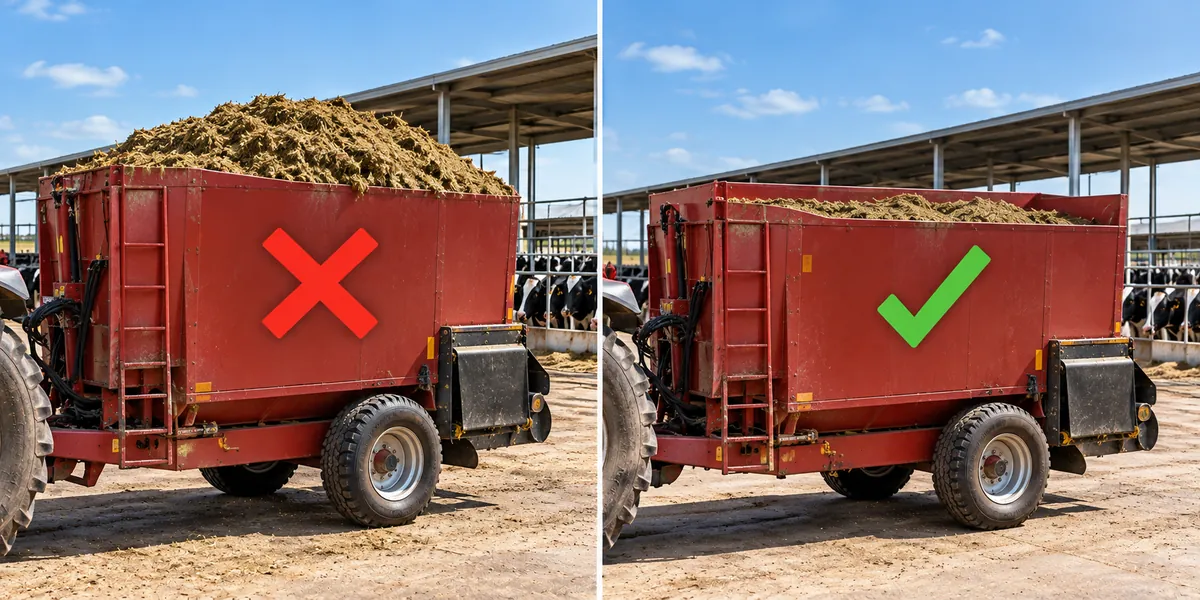
3. Mixer wagon control. By sampling the start, middle and end of the load, the Penn State Box helps detect over-mixing, worn knives, uneven delivery or an incorrect loading order before the problem shows up in the bulk tank. Details in TMR mixer wagon.
Already weighed the fractions? See your distribution instantly.
Enter how much was retained on each sieve (in grams). We convert it to percentages and compare it with the TMR reference range (Grant, 2026). Starting values are an example (1,000 g sample).
Weight retained per sieve
Distribution vs. reference range (TMR)
Low cost, and the Penn State Box doesn’t work alone
Compared with lab analyses, the Penn State Box costs very little, can be used on the farm as often as needed, and gives immediate results. The works by Maulfair & Heinrichs (2012) and Caccamo et al. (2014), together with Kononoff et al. (2003) and the Penn State Extension material (Heinrichs & Jones, 2025), are among the references behind this content.
The Penn State Box’s value lies in the trend: it only works when sampling is always done the same way. And results should be interpreted together with:
- NDF of the ration and forages;
- sample moisture (dry matter), since very wet samples may not separate well;
- dry matter intake;
- rumen pH and rumination;
- milk fat.
Technical notice: the Penn State Box measures physical distribution. The nutritional interpretation integrates DM, forage NDF, starch, intake and animal response, and must be made by the responsible technician.
Bring the Penn State Box to your dairy
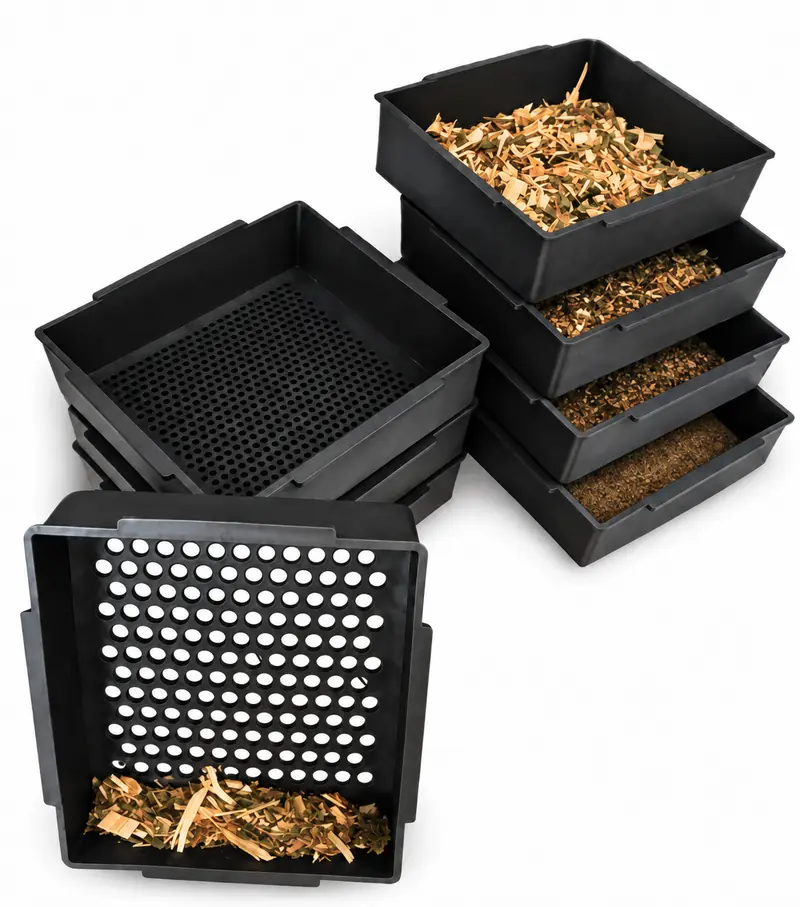
Penn State Box
3 sieves (19 / 8 / 4 mm) + closed pan · fiber-reinforced polypropylene
Get my sieve set
Your Penn State Box measures. The AI interprets.
This content started as a question asked to Ruminants.ai. Create your account, enter the weights of the four fractions and, in seconds, get the calculated percentages, the comparison with the reference ranges and a nutritional reading that tells you where to look and what to confirm before acting.
Create your Ruminants.AI accountNext in the series: physically effective fiber, what the Penn State Box shows and what it doesn’t.
References
- Caccamo, M. et al. 2014. Journal of Dairy Science. DOI: 10.3168/jds.2012-6490
- Grant (2026). Penn State Particle Separator reference ranges for TMR (% as-fed), Table 1. Presented in Dr. Mike Hutjens’ lecture.
- Heinrichs, J.; Jones, C. M. 2025. Penn State Particle Separator. Penn State Extension. extension.psu.edu/penn-state-particle-separator
- Kononoff, P. J. et al. 2003. Journal of Dairy Science. DOI: 10.3168/jds.S0022-0302(03)73773-4
- Maulfair, D. D.; Heinrichs, A. J. 2012. The Professional Animal Scientist.
- Santafé Agroinstituto; Ruminants.AI. 2026. Penn State Particle Separator – User Manual.